The essentials at a glance: our exclusive analysis of TikTok Shop France data (October-November 2025) reveals a market worth €50.5 million. While the average revenue per store is €1,500, the Health and Nutrition verticals significantly outperform, achieving revenues of up to €6,000. It is in these niches that the “ideal product” is currently to be found.
From experiment to essential sales channel
TikTok Shop is no longer just a trend, it’s a major new frontier for e-commerce in France. To go beyond hunches and identify the real opportunities of Discovery commerce, our TikTok Shop agency experts audited transactions from October 7 to November 5, 2025.
The verdict is clear: with a sales volume of €50.5 million generated over this period alone, the platform has established itself as an indispensable growth lever. Faced with this acceleration, a strategic question arises for brands: what is the profile of the best-seller on TikTok Shop? This analysis by our TikTok Shop experts deciphers the metrics to provide actionable benchmarks.
TikTok Shop market analysis: a hyper-growth ecosystem
Before defining the characteristics of the winning product, you need to understand the current dynamics. The performance of your offering will depend as much on its intrinsic qualities as on the structure of the market. Our data analysis reveals a promising playing field:
- Real economic clout: intense commercial activity, with total sales of €50.5 million.
- Revenues vary according to niche: the median revenue per store is €1,500, but this figure rises to between €5,000 and €6,000 for high-value sectors such as health or nutrition.
- Sustained growth (+30%): median sales growth in the major categories jumped by 30% compared to the previous period. More than half of all universes are growing at double-digit rates.
This phase of general acceleration is excellent news: it means that it is still possible to penetrate the market before positions become entrenched.
The driving force behind performance: why your product must first appeal to designers
On TikTok Shop, traditional business logic is reversed. A brand’s first customer is not the end consumer, but the content creator. Analysis of data from the most successful stores reveals an inescapable truth: commercial performance is massively dependent on affiliation. This reality completely redefines the characteristics of a “good product”, and the data show that brands that master this model outperform: a branded boutique generates average sales of €37,500, almost double that of a €19,500 reseller.
Proof in numbers: the ultra-dominance of affiliate marketing
The data on where the sales of the best stores come from are unambiguous, and demonstrate the overwhelming weight ofaffiliation in the TikTok Shop business model.
- 84% of the sales of the best stores come from affiliate revenues.
- 9% is generated by direct sales via the brand’s managed account.
- 7% comes from sales via the Shopping Mall (the platform’s shopping gallery).
What’s more, the median affiliate share per boutique is 95%. This means that for half of the most successful stores, almost all sales are generated by third-party designers. For a product to succeed, it has to be massively adopted, promoted and sold by a network of designers.
Strategic implications for your product offering on TikTok Shop
This dominance of affiliation has direct consequences for the way a product is designed and positioned. The “ideal product” on TikTok Shop is in fact an indissociable “package”, a “creator-native” product whose characteristics are defined by the data themselves: a quality product (rated > 4.2/5), visually demonstrable (generating 79% of sales in video), associated with an attractive commission (median 13%) to mobilize a large network of creators (median 65). It must be designed to be sold by others.
The key to success on TikTok Shop lies in the ability to design a “creator-native” offer, conceived from the outset to be relayed and sold by an ecosystem of creators. Now that this fundamental principle has been established, we can sketch out, with figures to back it up, the precise profile of the product that meets these requirements.
Profile of the best-selling product on TikTok Shop
To answer the central question of this article, we’re going to draw up a profile of the ideal product. Based on an analysis of the 500 best-performing products in all categories, it defines a typical profile using objective, quantifiable criteria. This profile constitutes a veritable roadmap for any brand seeking to launch a relevant offer on the platform.
Recipe for success: analysis of key characteristics
The typical profile of the best-selling product is defined by six fundamental characteristics.
| Caractéristique | Données clés et analyse |
| Prix | La médiane se situe autour de 21-22 €. Le cœur du marché est la zone 10-30 € (44,8 % du CA), mais les produits à plus de 50 € représentent une part non négligeable (27,6 %), indiquant des opportunités pour des produits à plus forte valeur. |
| Qualité perçue | La note médiane est de 4,5/5. Près de 81 % du chiffre d'affaires est réalisé par des produits notés 4,2/5 ou plus. Une performance durable est indissociable d'une excellente qualité et d'une forte satisfaction client. |
| Commission d'affiliation | La médiane s'établit à 13 %. Le "sweet spot" se situe entre 10 % et 20 %, une fourchette qui concentre près de 74 % du CA. Dans les catégories hyper-concentrées (ex: Health, Nutrition), une commission dans le haut de cette fourchette (15-20 %) est une condition sine qua non pour détourner les créateurs des leaders établis. |
| Ancienneté | L'âge médian est d'environ 3 mois. Le marché valorise les nouveautés, mais les produits qui réussissent sont ceux qui s'installent dans la durée. La stratégie idéale combine des "produits héros" établis et des lancements réguliers. |
| Force de frappe des créateurs | Le succès d'un produit repose en moyenne sur une médiane de 65 créateurs. La performance n'est pas le fruit d'un seul "coup" d'influence, mais du volume et de la répétition générés par un large portefeuille de créateurs. |
| Format de vente principal | Environ 79 % du chiffre d'affaires provient des vidéos, contre seulement 16 % pour les sessions de live shopping. La performance de fond est assurée par des vidéos courtes et efficaces, tandis que le live agit comme un accélérateur pour des temps forts. |
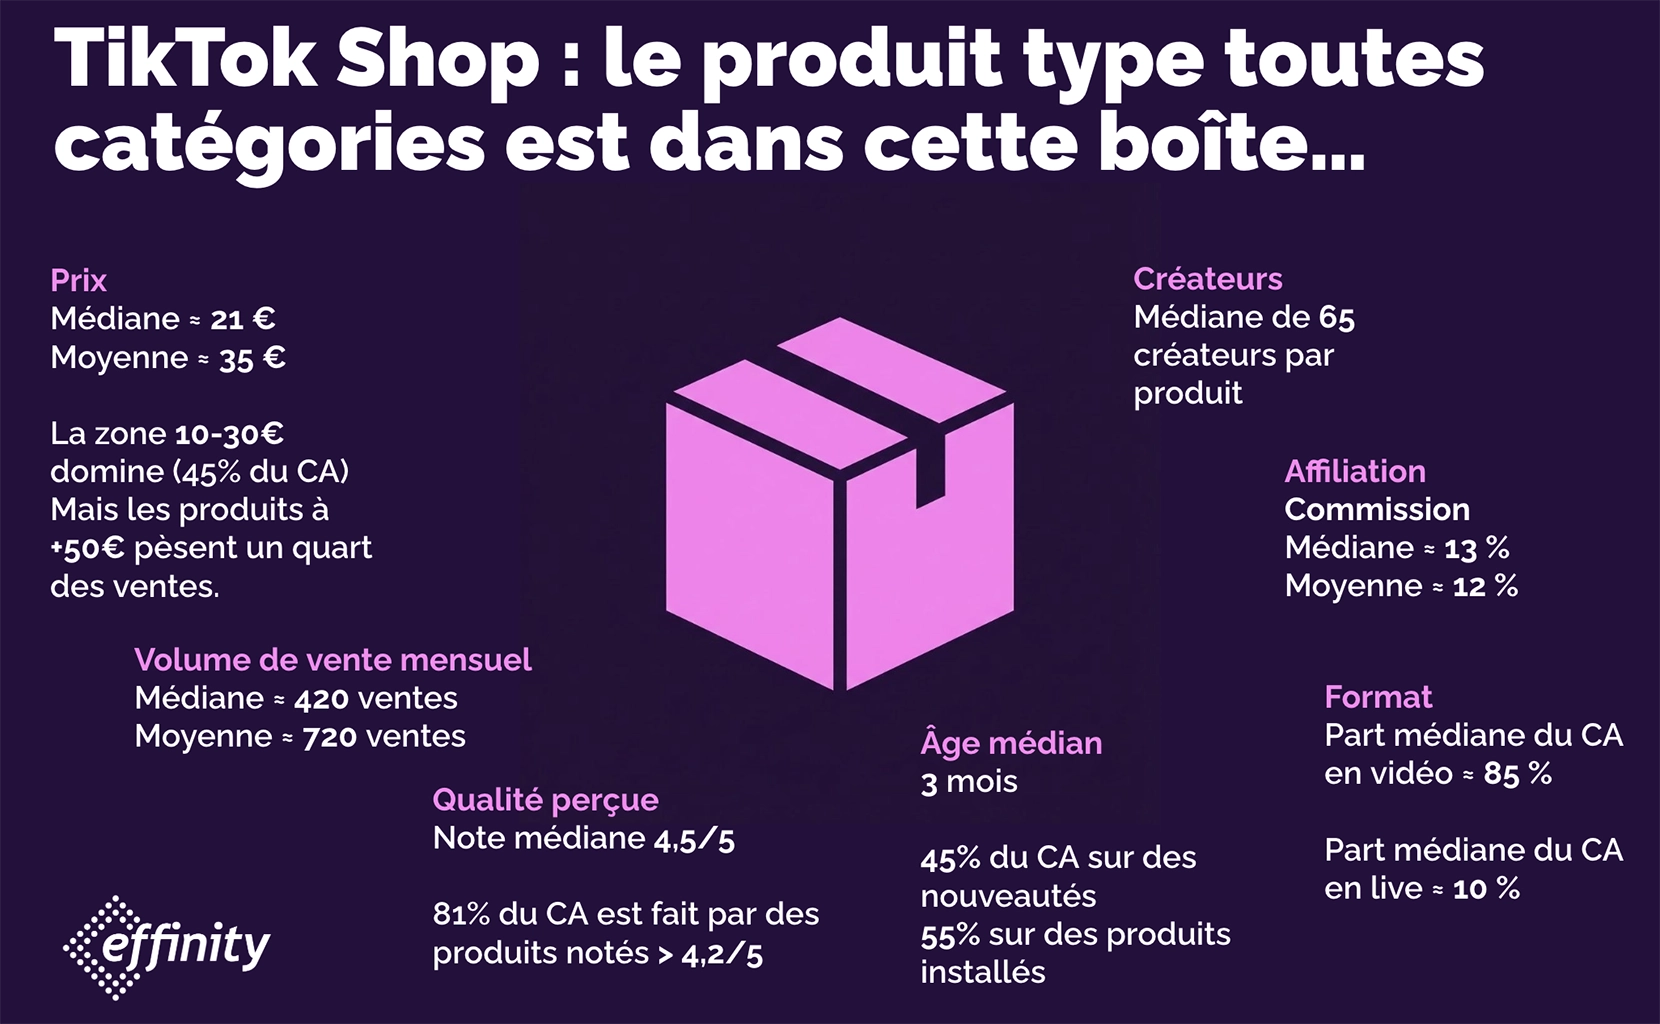
The ideal product is therefore an affordable item, highly rated, supported by an attractive commission and promoted by a large number of creators, mainly via short videos. However, this overall picture of a €22 product promoted by 65 creators hides very different realities. As we shall see, in the world of sports, the price can climb to €72, while in beauty, the number of creators needed explodes to over 130 to achieve performance.
Nuances by category: the ideal product for every world
While the overall profile provides a clear direction, the real strategic finesse lies in adapting the offer to the specificities of each category. A beauty product doesn’t sell like an electronic accessory. This section compares the characteristics of best-selling products in the main TikTok Shop universes to reveal the different recipes for success.
Comparative analysis of two flagship categories
| Beauty & Personal Care | Phones & Electronics | |
| Prix | Médiane ≈ 16 €Moyenne ≈ 21 € | Médiane ≈ 42 € Moyenne ≈ 48 € |
| Ventes | Médiane ≈ 900 unitésMoyenne ≈ 1 270 | Médiane ≈ 450 unitésMoyenne ≈ 890 |
| CA médian | ≈ 12,9 k€ | ≈ 13,7 k€ |
| Note médiane | 4,5/5 | 4,2/5 |
| Créateurs | Médiane ≈ 133 | Médiane ≈ 72 créateurs |
| Commission médiane | ≈ 15 %, | ≈ 10 % |
| Formats | ≈ 90 % vidéo≈ 9 % live | ≈ 78 % vidéo≈ 16 % live |
Interpretation of typical profiles by category
An analysis of these data reveals highly contrasting product strategies.
- Beauty & Personal Care: the model is based on very affordable prices (under €20) and high ratings, generating very high sales volumes. Success is conditioned by the ability to mobilize a very large number of designers (often over 100), thanks to a motivating commission (15% in beauty, for example). See our guide on how to choose the right beauty influencers for your brand.
- Phones & Electronics: here, the model is reversed. Median prices are much higher (€40 to over €70), sales volumes are logically lower, and the emphasis is on live video demonstrations to justify the investment.
Success on TikTok Shop is not a question of “one size fits all”. Performance comes from the perfect alignment between your product, price, commission and the codes of your target category. Armed with these global and specific analyses, brands can now build a clear, actionable roadmap to launch.
5 actions to build your “TikTok Shop Native” offer
This data-driven analysis enables us to go beyond preconceived ideas and build a genuine product strategy. For a brand wishing to succeed on TikTok Shop, the approach can be summed up in five key actions.
- Action 1: Build a Creator-Centric offer. Your product must be designed to be sold by others. Its promise must be simple and visually striking. The affiliate commission, ideally between 12% and 15%, is not a cost but your main marketing investment to activate the platform’s engine.
- Action 2: Choose your playground carefully. Don’t enter a market blind. Analyze the concentration of your target category. A fragmented market like beauty offers more opportunities for a new entrant than a hyper-concentrated market like nutrition, where barriers to entry are much higher.
- Action 3: Set the right Price/Quality ratio. To generate volume, aim for the €10 to €30 price range. But never sacrifice quality: a minimum score of 4.2/5 is essential to build sustainable performance. Customer satisfaction is the best guarantee of longevity.
- Action 4: Focus on video, accelerate with live. The heart of your content strategy should be short videos, the format that generates nearly 80% of sales. Select your products so that they are easy to demonstrate in this format. Use live shopping as a gas pedal for highlights: launches, promotions and special operations.
- Action 5: Nurture a portfolio of creators. Never depend on a single star. The success of a best-selling product is measured by the number of creators who adopt it, with a median of 65 creators per successful product. Volume and repetition of the message by dozens of different voices are the key to credibility and conversion.
Source: Kalodata – Data: Top 10 categories, Top 450 stores, Top 500 designers, Top 500 products