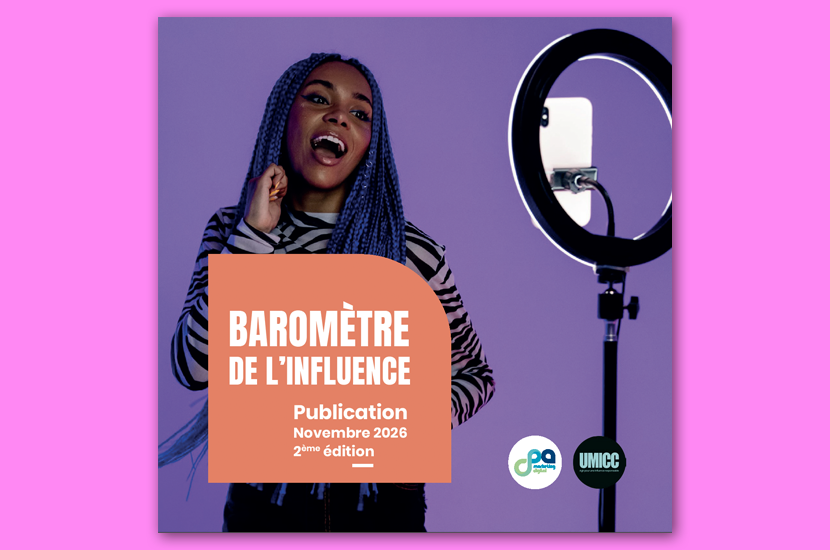
Influencer marketing is gaining visibility, but audiences are interacting less. Commercial collaborations remain in the minority, gifting is on the rise, and affiliate marketing is proving its ability to generate measurable sales. The 2026 Influence Barometer reveals a market in transition, where creators’ value is no longer limited to their audience or engagement rate.
Published in November 2026 by the CPA and the UMICC, the Barometer analyzes influence in France over the period from April 1, 2025, to March 31, 2026. This second edition includes LinkedIn and delves deeper into three complementary dimensions: influence, gifting, and affiliation.
Effinity, a CPA member and contributor to the study, reviews the key findings and their implications for advertisers.
Beyond the numbers, one question runs through this issue: How can brands move from one-off influencer campaigns to partnerships that can make a lasting contribution to their visibility, word-of-mouth, and sales?
Download the 2026 Influence Barometer
2026 Influence Barometer: Key Findings in 6 Figures
- 311,000 brand mentions (−3.7%) generated by 46,300 active creators, excluding LinkedIn.
- 30.4 billion views (+10.2%), but 1.17 billion engagements (−9.4%).
- 86% of content was organic, compared to 85% in 2025.
- 23,000 gifting campaigns, representing a 52% increase.
- €376 million in revenue attributed to affiliate marketing for advertisers.
- €11 in revenue for every €1 in commission paid to affiliate creators.
These figures reflect a significant shift: influence can no longer be assessed using a single metric. Visibility, engagement, referrals, and measured sales represent different forms of contribution, each requiring complementary measurement approaches.
How do you interpret the Barometer’s figures?
The study is organized into three parts, the scope of which must be distinguished.
The influence is analyzed based on cross-referenced data from Kolsquare, Reech, Traackr, and Favikon. The scope includes creators with more than 10,000 followers, at least 30% of whose audience is located in France, who have mentioned one of the 1,000 brands being tracked. The platforms analyzed are Instagram, TikTok, Snapchat, YouTube, X, and LinkedIn. Instagram Stories are excluded.
The gifting data is based on information from Influence4You, Sampleo (Webedia), and Skeepers. It pertains to campaigns in which products or services are sent to creators on Instagram, TikTok, and YouTube. This data does not cover the entire French market.
The Affiliate segment measures clicks, sales, attributed revenue, and commissions paid across ten categories. Its scope of advertisers and measurement methods differ from those of the other two segments.
Finally, the inclusion of LinkedIn is the main new feature in this edition. To ensure comparability, year-over-year changes in the Influence segment are calculated excluding LinkedIn. Volumes that include this network are identified separately.
Les indicateurs d’influence et de gifting correspondent à des périmètres d’observation différents
| Indicateur | 2025 | 2026 | Évolution |
| Créateurs actifs, hors LinkedIn | 47 200 | 46 300 | −2 % |
| Mentions de marques | 322 000 | 311 000 | −3,7 % |
| Vues | 27,6 Mds | 30,4 Mds | +10,2 % |
| Engagements | 1,29 Md | 1,17 Md | −9,4 % |
| Collaborations commerciales | 15,5 % | 14,3 % | −1,2 pt |
| Campagnes de gifting | 15 000 | 23 000 | +52 % |
| Vues générées par le gifting | 1,4 Md | 2 Mds | +44 % |
Influence in France: More Visibility, Fewer Interactions
86% of brand mentions are unsolicited
France has an average of 202,000 content creators with more than 10,000 followers on the major platforms included in this estimate.
Of these, 46,300—excluding LinkedIn—mentioned at least one of the 1,000 brands being tracked. They posted 311,000 pieces of content, or about 852 brand mentions per day.
This content generated 30.4 billion views, up 10.2%. At the same time, engagement fell by 9.4% to 1.17 billion. The average engagement rate published by the Barometer stood at 2.03%, down 0.29 percentage points.
But the most revealing figure concerns the nature of the posts: only 14.3% of mentions were related to commercial collaborations. The remaining 86% were spontaneous shares, with no compensation identified in the study.
The influence of brands therefore extends far beyond the campaigns they organize and directly fund.
Effinity’s takeaway: Creators who spontaneously talk about a brand represent a pool of potential influencers. Identifying them, understanding their motivations, and pinpointing the most relevant profiles can become key steps in recruiting partners. The challenge isn’t just to select a creator for an upcoming campaign, but to build a relationship with those who already share an affinity with the brand.
Instagram dominates, while TikTok stands out for its reach
Instagram accounts for 60% of the content viewed, 55% of the views, and 49% of the engagement. It remains the leading platform for commercial influence in France.
TikTok accounts for about 28% of the content, but generates nearly 41% of the views and 49% of the engagement. Its contribution therefore far exceeds its share of the total number of posts.
LinkedIn, now included in the Barometer, accounts for 10% of content creators but less than 1% of views. Its value should be assessed based on other criteria, particularly professional visibility and reputation.
These discrepancies highlight the need to choose platforms based on the expected role of content creators, rather than simply comparing their audience sizes.
Micro-creators have the highest engagement rates
Creators with between 10,000 and 50,000 followers account for 51% of active profiles. Their average engagement rate is 5.03%, with 9.9% on TikTok and 4.2% on Instagram.
Larger creators have greater reach, but their average engagement rates are generally lower.
The Barometer recommends relying on micro-creators to build a foundation of engagement, while engaging larger influencers to achieve reach and brand awareness goals.
For advertisers, however, it’s not a matter of pitting small creators against large ones. A program can bring together inspiring influencers, experts who build trust, creators who drive traffic, and others who directly contribute to sales.
Widely Varying Trends Across Sectors
: Fashion and Beauty still account for nearly 70% of brand mentions. However, several sectors are showing notable trends:
- Gaming: the highest engagement rate in the Barometer, at 10.3%, despite a limited number of views.
- Finance: an engagement rate of 5.74%, with 55% of mentions concentrated on LinkedIn.
- Food: Engagement rose from 3.05% to 3.84%, accompanied by a 51% increase in views.
- High-Tech: 1.34% of mentions, but about 3% of engagements, with an average engagement rate of 4.49%. LinkedIn accounts for 37% of its mentions.
- Travel: a 37% decline in mentions, with an engagement rate of 4.94%.
- Automotive: Engagement down 77% despite an increase in views.
The market thus appears more polarized: some niche sectors generate high levels of engagement, while others focus primarily on building their visibility.
For brands, these differences serve as a reminder that an influencer strategy must be tailored to the specific usage patterns and decision-making processes of each sector.
LinkedIn: Influence Now Extends Beyond Traditional Creators
The emergence of LinkedIn is one of the major developments highlighted in the 2026 Barometer.
With approximately 5,000 additional creators, the platform introduces a form of influence that differs from what is traditionally seen on Instagram or TikTok.
Content on LinkedIn is driven by professionals whose credibility often rests more on their expertise or job title than on their status as creators.
Five Brand Voices
The Barometer identifies five complementary profiles:
- The executive, who embodies the company and builds a personal following.
- The subject matter expert, who brings credibility based on their experience.
- The employee, whose public statements contribute to the company’s collective visibility.
- The brand-as-media, which produces editorial content that goes beyond promoting its products.
- The independent influencer, who offers an outside perspective and contributes to the company’s credibility.
The examples provided are telling. At Capgemini, 72 French employees who post regularly on LinkedIn have a combined total of 735,015 followers. Their strength lies less in their individual prominence than in the combined size of their audiences.
For E.Leclerc, one of the main voices is an independent retail analyst who has published 160 mentions of the brand—11.4 times more than its president.
These examples show that a company’s influence can extend far beyond its official accounts and its most visible employees.
What this means for advertisers
On LinkedIn, paid collaborations with B2B experts, employee advocacy, and Thought Leader Ads are different mechanisms from gifting and promotional codes.
The value of these messages is measured more in terms of credibility, brand awareness, and consideration than in immediate sales.
Effinity’s approach involves expanding the partner ecosystem. In a B2B environment, relevant influencers can include experts, specialized media outlets, executives, or recognized professionals. Not all of them are intended to be compensated or included in an affiliate program. However, their contributions can be identified and incorporated into a more comprehensive engagement strategy.
For a B2B brand—or for a consumer brand that wants to influence business decisions—activating these voices is another strategic tool to leverage, in collaboration with an influencer marketing agency that understands how to distinguish between these networks.
Gifting: Generating More Visibility and Content
The gifting A significant increase in scale is expected in 2026. The three contributing organizations report 23,000 campaigns—a 52% increase—with 331,000 posts (+3%) and 2 billion views (+44%).
At the same time, interactions fell by 9 percent, to 69 million. The interaction rate relative to views dropped from 5.9 percent to 3.5 percent.
Brands are therefore launching more campaigns while seeking greater visibility with each post. They are also becoming more selective: the acceptance rate for applications drops from 15% in 2025 to 6% in 2026.
TikTok is now the leading platform for gifting based on the metrics analyzed. The high-tech sector, in particular, is seeing a sharp increase in the number of campaigns, which are often smaller and more targeted.
From Social Content to Visibility in Search Engines and AI
The Barometer highlights a shift in the role of content produced by creators. Beyond simply being shared with a community, this content can serve as social proof, enhance product descriptions, fuel advertising campaigns, and contribute to brands’ digital presence.
The study identifies three key issues:
• Google search results, in which certain content from social media platforms may appear.
• Social SEO, which is linked to the growing use of Instagram and TikTok to search for products, recommendations, or information.
• Visibility in AI responses, which can draw on information from creators’ content, either directly or through accessible sources.
However, it is important to distinguish this potential for visibility from its actual measured impact. The Barometer does not demonstrate that an increase in the number of gifting posts automatically leads to greater visibility in AI responses. The accessibility of posts, their relevance, their potential reposting by other sources, and the mechanisms specific to each system all influence this visibility.
Effinity Reading: Content Whose Value Extends Beyond Its Initial Publication
For brands, a creator’s content can become an asset that can be leveraged across multiple platforms. A demonstration video can introduce a product on TikTok, be repurposed on an e-commerce product page, contribute to an advertising campaign, or appear in search results. These different uses are not evaluated in the same way. The goal, therefore, is not simply to produce more content, but to develop partnerships capable of generating relevant, reusable content whose various uses can be tracked.
Visibility in AI responses is an additional factor to consider, though it should not be confused with views or engagement on social media. To learn more, check out our analysis of user-generated content (UGC) and social proof, as well as our reflection on the Content Strategy in the Age of AI.
Affiliate Marketing: €376 million in revenue attributed to creators
The third section of the Barometer confirms the growing trend toward performance-based influence.Affiliate marketing confirms that influence can transform attention into measurable sales.
Across the ten categories analyzed, creators generated 291 million clicks, 3.6 million measured sales, and 376.5 million euros in attributed revenue.
More than 3,000 advertisers have embraced affiliate marketing, while creators have earned 33.3 M€ in commissions.
The average ratio stands at €11 in attributed revenue for every €1 in commission paid, compared with €8 in the previous report. However, differences in the scope of the two reports mean that this increase should be interpreted with caution.
Nearly eight out of ten posts are created by content creators with fewer than 250,000 followers: commercial success, therefore, does not depend solely on the largest audiences.
Which sectors generate the most revenue?
| Secteur | CA attribué | Commissions créateurs | CA pour 1 € de commission |
| Maison, jardin & bricolage | 85,1 M€ | 5,0 M€ | 17 € |
| Mode | 74,6 M€ | 6,6 M€ | 11 € |
| High-Tech | 71,7 M€ | 8,7 M€ | 8 € |
| Beauté, Santé, Hygiène | 51,0 M€ | 6,1 M€ | 8 € |
| Sport | 23,0 M€ | 2,5 M€ | 9 € |
| Loisirs, Culture & Divertissement | 21,4 M€ | 1,1 M€ | 20 € |
| Travel | 21,1 M€ | 1,3 M€ | 17 € |
| Automobile | 14,8 M€ | 0,4 M€ | 37 € |
| Food | 8,4 M€ | 1,3 M€ | 7 € |
| Marketplace | 5,4 M€ | 0,4 M€ | 14 € |
| Total | 376,5 M€ | 33,3 M€ | 11 € |
Home, Garden, and DIY lead in terms of attributed revenue. The Automotive sector has the highest ratio, but based on a relatively low volume of commissions. These differences do not necessarily mean that certain sectors are more profitable than others. These discrepancies partly reflect the increase in the number of advertisers analyzed (+43% in Beauty, Health, and Hygiene). To choose the right profiles in this sector, check out our guide on Selection of influencers in Beauty, Health, and Personal Care.
The revenue-to-commissions ratio is not a comprehensive measure of ROI. It does not necessarily take into account fixed costs, provisions, content production, media expenses, or the resources required to support partners.
Nor does it make it possible to determine what proportion of sales is truly incremental—that is, sales that would not have been generated without the creators’ involvement. It is a useful business metric, but one that should be supplemented by other measures depending on the advertisers’ objectives.
The Example of Sports: Why Performance Alone Is Not Enough to Drive a Partnership
The analysis of the sports sector, presented in the Barometer, illustrates particularly well the shift in focus from influence to performance.
Between the two periods studied, attributed revenue increased by 59.7%, rising from 14.4 to 23 million euros. The number of sales increased even more: +90.3%, from 139,456 to 265,340 orders.
This growth is driven by an increase in clicks (+43.1%) and the conversion rate, which rose from 0.92% to 1.22%.
But behind this improvement in business results, other indicators are trending differently:
- The average shopping cart total fell from €103.38 to €86.76.
- The commission rate fell from 11.97% to 10.86%.
- Average compensation per sale decreased from €12.38 to €9.42.
- The revenue-to-commissions ratio increased from €8.35 to €9.21.
These results show that a program’s commercial performance can improve even as creators’ per-unit compensation decreases. For advertisers, the program generates more attributed revenue per euro of commission. For publishers, however, the decline in compensation per sale may undermine the program’s appeal.
New requirements for managing relationships with creators
The Barometer also notes a trend toward greater professionalism in sports partnerships. Paid publications are up 60.5%, while campaigns based solely on product placements have declined sharply.
The study recommends considering models that combine fixed compensation for content creation, sales commissions, and progressive bonuses. It also highlights the need to move beyond last-click attribution alone, which risks underestimating the value of creators involved in discovery or consideration who do not directly trigger a conversion. Finally, it emphasizes the importance of retaining top talent and improving the commercial terms offered to partners.
Effinity’s takeaway: driving the value of the partnership over the long term
The example of sports highlights an important distinction: measuring the sales attributed to a creator is not enough to gauge the value of the relationship with that creator.
Three factors must be taken into account:
The partner’s contribution. Attributed sales are important, but they do not necessarily reflect the full extent of the partner’s influence on discovery, recommendation, and decision-making.
Its compensation model. A decrease in per-unit commissions can improve a financial metric from the advertiser’s perspective while undermining the partner’s motivation. Compensation must take into account the nature of the partner’s contribution and investment.
The quality of the relationship over time. Retaining top creators, evolving strategies, and the ability to develop new collaborations can contribute to the program’s long-term success.
This is one of the principles of Partner Management: managing a portfolio of partners as a growth asset, rather than as a series of independent campaigns.
Social Commerce: Affiliate Marketing Is Becoming a Feature of Platforms
The Barometer’s preface highlights another shift: the convergence of content, recommendations, and commerce.
YouTube launched its YouTube Shopping affiliate program in France on October 13, 2026. Meta is expanding its collaboration initiatives between brands and creators, while TikTok Shop directly integrates recommendations and purchases into short-form video journeys.
Tracking a referral all the way through to the sale—a practice long established by affiliate platforms—is gradually becoming a native feature of social media. For creators, this trend opens up new monetization opportunities. For advertisers, it adds new environments to manage.
Effinity’s take: The more collaboration mechanisms proliferate, the more important it becomes to manage partners holistically. The challenge is not to pit traditional affiliation, influence, and social commerce against one another, but to coordinate these systems, their partners, their compensation structures, and their performance data. This is the logic behind Effinity’s Partner Management platform.
Five Takeaways from the Brand Barometer
Beyond its statistical findings, this second edition highlights five priorities for advertisers.
1. Stop measuring influence solely by engagement
The increase in views and the decline in engagements highlight the limitations of an analysis based on a single metric. It is important to distinguish between visibility, interaction, consideration, attributed sales, and—when methods allow—incremental contribution. Each objective must have appropriate metrics.
2. Build a portfolio of complementary creators
Micro-creators continue to excel in engagement, but larger profiles play other roles. A strategy must combine different profiles based on their ability to inspire, inform, reassure, or convert. The complementary nature of the partners is just as important as their individual performance.
3. Connecting gifting, influence, and affiliation
Gifting contributes to content creation and social proof. Influencer collaborations drive recommendations. Affiliate marketing allows certain sales to be attributed to partners. These mechanisms can complement one another, but the study’s results do not directly demonstrate that one drives the performance of the other. Brands would be wise to coordinate these initiatives within a cohesive strategy.
4. Integrate visibility into search engines and AI systems
Creators’ content can exist beyond their original network. It can potentially play a role at various stages of the research, comparison, and decision-making processes, particularly in search and AI environments. This contribution must be analyzed using specific metrics, without equating content volume with actual visibility in AI responses.
5. Moving from Campaigns to Partner Management
This is the overarching lesson Effinity draws from the Barometer. Influence mobilizes creators, experts, ambassadors, and opinion leaders. The ways in which people collaborate are becoming more diverse, and measuring their contributions is becoming more complex.
So it’s no longer just a matter of asking, “Which creators should I engage for my next campaign?” but rather, “Which partners should I develop, for what objectives, and how can I measure their contribution over time?” ”
Partner Management provides an organizational solution to this challenge: identifying, recruiting, engaging, compensating, and retaining partners through a coordinated approach. This evolution must also protect the interests of creators. The UMICC-Ipsos study cited in the Barometer notes that only 40% make their living exclusively from their creative work. Sustainable success requires recognized and shared value creation.
To turn these insights into an action plan, our guide to developing your 2026 influence strategy details the steps involved in a campaign, from the brief to follow-up.
Conclusion: From Influence to Partner Management
The 2026 Influence Barometer paints a picture of a market that is more visible, more diverse, and more focused on performance measurement. But it also reveals that creators’ contributions cannot be reduced to views, engagements, or attributed sales alone.
For Effinity, this trend confirms the value of a holistic approach: no longer just managing influencer campaigns, but building and developing an ecosystem of growth partners. The goal is to better identify each partner’s role, coordinate activations, adjust compensation, and measure contributions over time.
Download the 2026 Influence Barometer to view detailed analyses by sector, network, and creator type.
Source: Influence Barometer, 2nd edition, November 2026, CPA and UMICC. The analyses presented as “Effinity’s take” constitute a strategic interpretation of the study’s results.